Extremes in Benthic Ecosystem Services; Blue Carbon Natural Capital Shallower Than 1000 m in Isolated, Small, and Young Ascension Island’s EEZ
 David K. A. Barnes
 Chester J. Sands
 Andrew Richardson
 Ness Smith3
- 1British Antarctic Survey, NERC, Cambridge, United Kingdom
- 2Conservation Department, Ascension Island Government, Georgetown, United Kingdom
- 3South Atlantic Environmental Research Institute, Stanley, Falkland Islands
Biodiversity tends to decrease with increasing isolation and reduced habitat size, and increase with habitat age. Ascension Island and its seamounts are small, isolated and relatively young, yet harbor patchily dense life. Large areas of these waters are soon to be designated as a major Marine Protected Area. Given the remote location there are few local threats to the region. However, global climate related stressors (e.g., temperature and acidification) and arguably plastic pollution are key issues likely to impact ecosystem services. We evaluate the accumulated carbon in benthos around Ascension Island’s EEZ shallower than 1000 m using data collected over two research cruises in 2015 and 2017 through seabed mapping, seabed camera imagery and collections of benthos using a mini-Agassiz trawl. Benthos shallower than 1000 m essentially comprises the coastal waters around Ascension Island and three seamounts (Harris-Stewart, Grattan, and Unnamed). There is considerable societal benefit from benthic carbon storage and sequestration through its mitigation value buffering climate change. This service is often termed “blue carbon.” Overall we estimate that there is at least 43,000 t of blue carbon, on the 3% of Ascension Island EEZ’s seabed which is <1000 m, mainly in the form of cold coral reefs. Two thirds of that occurs around the main island of Ascension, but it is very unevenly distributed on the seabed. Seabed roughness (e.g., rocky outcrops) seems most important for the development of blue carbon hotspots. About 21% of the total blue carbon is considered to be sequestered (removed from the carbon cycle for 100+ years) = 9000 t Carbon. At the 2019 Shadow Price of Carbon the proportion of CO2 considered sequestered is £29–59. As 9000 t C this is equivalent to 33,070 t CO2, which in 2019 is valued at approximately £1–2 million. With time, this increases with rising value of carbon, but also annual increment of carbon deposition, to £2–4 million by 2030. Thus even when biogeographic values of isolation, size and age are least favorable to biodiversity, the natural capital stock and future services of benthic ecosystems can be considerable and generate quantifiable economic return on their conservation.
Introduction
Ascension Island is a very isolated, young and small land mass sitting just south of the equator at −7°56 latitude and −14°22 longitude. It is approximately 2,250 km from the east coast of South America and 1,600 km from the west coast of Africa, with the nearest landmass being St. Helena, approximately 1,200 km to the south-east. Biogeographically these factors would all suggest low biodiversity. Such extreme locations are often the furthest from anthropogenic impacts and have very high ratios of Exclusive Economic Zones (EEZ) to land area. There are dense patches of life around Ascension Island coast and associated seamounts, in the shallows and important cold coral stands in deeper water (Nolan et al., 2017). The large EEZ around Ascension Island is likely to have considerable natural capital and ongoing ecosystem services derived from it. Two decades ago the global value of ecosystem services was estimated at US$30 trillion per year (Constanza et al., 1997). Since then understanding and demonstration of ecosystem services value has rapidly increased (Balmford et al., 2002; de Groot et al., 2012). Marine ecosystem service valuations, particularly within deep sea environments are, however, more challenging and there have been few attempts to value services provided by benthic ecosystems (Foley et al., 2010; Jobstvogt et al., 2014). The EEZ’s of remote islands largely consist of deep sea ecosystems, and such places are a current focus for designation of very large Marine Protected Areas (VLMPA), such as those designated around Easter Island (by Chile) and Pitcairn Island (by United Kingdom) in the Pacific, and those implemented around South Georgia and the South Sandwich Islands and the South Orkney Islands in the Southern Ocean (Trathan et al., 2014). In the South Atlantic too, there is support for a no-take VLMPA around Ascension Island which was officially announced by the United Kingdom Government in March 2019 and which is also supported by the Island Council, subject to funding. Designation of these VLMPAs are not without controversy as it can involve finance losses (e.g., from closing or reducing commercial fishing) and incur costs (e.g., from monitoring, managing threats and policing use). It is not always clear how societal value can be demonstrated from VLMPAs and the ecosystem services they protect, although significant progress has recently been made (Adams, 20141) and has started to address the considerable values provided by marine carbon capture and storage.
Blue carbon is that captured through photosynthesis and held within marine (mainly coastal) ecosystems. The International blue carbon initiative of the United Nations Environment Programme2 argues that the 2% of global area represented by coast is responsible for half of global carbon sequestration and that it is much more efficient at storage than forest (Duarte et al., 2005). There are powerful arguments for why we need to understand and measure blue carbon. As the difficulty and cost of mitigation or reduction of climate change and it’s drivers (such as CO2) is becoming clear all carbon capture mechanisms need consideration. Because it is a highly efficient, naturally occurring and manageable mechanism (Duarte et al., 2005) the scientific profile of measuring blue carbon has risen rapidly. To date measuring blue carbon has focused on assessment of how much carbon is captured and stored by accessible and efficient sinks, such as mangrove, salt marsh and seagrass beds (Murdiyarso et al., 2015). As in the current study this has mainly been carried out by sampling to estimate the density of organisms in a location and then estimating the portion of carbon within the organisms (% of loss on ignition).
Blue carbon can be important even in cold waters, such as on Southern Ocean continental shelves, where the pace of marine growth is slow, providing a negative feedback against climate change (Barnes, 2015; Barnes et al., 2018a). The MPAs around the remote South Orkney Islands and South Georgia and the South Sandwich Islands have low levels of blue carbon storage but still have key roles in such ecosystem services because of their large shelf areas (Barnes et al., 2016). To date little is known of the marine benthic biodiversity and potential ecosystem services from 100 to 1000 m around most remote Atlantic archipelagos, except for their commercial demersal fish and crustacean stocks. To progress this regionally consultation workshops were held, as part of a wider natural capital assessment programme3, for Ascension Island in February 2017 and June 2018, which resulted in the identification of priority areas to investigate. In June 2018, with an upcoming decision on a potential VLMPA designation under the UK Blue Belt Programme4, assessment of the marine environment was considered a high priority, in particular services such as blue carbon storage on the seabed within Ascension Island’s EEZ.
Blue carbon is captured when algae fix carbon from CO2 (from the atmosphere but dissolved in water), most of which is recycled on death by microbial breakdown. However, some is stored when it sinks to the seabed or is eaten by animals to be incorporated into tissues and skeletons (see Barnes and Sands, 2017). When such organismal storage (removed from the carbon cycle) is longer than 100 years, either through long life or burial, it can be termed sequestered. At this point the amount of blue carbon (standing stock) or natural capital can be allocated a monetary value; Social Cost of Carbon (SCC) or shadow price of carbon (SPC). This varies between nations, years, discount rate and even model types. Our assessment of Ascension Island’s benthic blue carbon aimed to answer the questions; How much blue carbon is there on Ascension Island’s seabeds? what biodiversity contains this? and what is its economic value? This should provide a first blue carbon baseline within 1000 m depth prior to the VLMPA establishment. These findings contribute evidence to a program of natural capital assessments (NCA) being implemented by the UK Joint Nature Conservation Committee (JNCC) and conducted by the South Atlantic Environmental Research Institute (SAERI) in the UK South Atlantic Overseas Territories.
Materials and Methods
Our method attempted to link seabed mapping (to characterize the study area < 1000 m depth), underwater imagery (to determine the variety of habitats and density of types of organisms) and trawl (to collect biological specimens to determine identification and carbon content). Combining these techniques can produce standing stocks of carbon held in marine organisms, by habitat, by major area (Barnes and Sands, 2017). An economic value can be placed on whatever total result is found by applying a standardized, internationally recognized value of carbon sequestered per unit mass.
The mid-Atlantic ocean study area was the coast of Ascension Island and three nearby seamounts (Figure 1). We used seabed mapping (multibeam swath – data available in Fremand and Barnes, 2019), imaging and targeted specimen collection to firstly assess benthic organism presence in the shallowest 1000 m of Ascension Island’s EEZ (Figure 2). We took 421 Shelf Underwater Camera System (SUCS) images around Ascension Island and 271 SUCS images at three nearby seamounts. Identification of specimens from imagery was supported by seven Agassiz tows around Ascension Island and six around the seamounts. All biological specimens visible in images were identified and recorded to at least Phylum and Class level. Most image specimens were identifiable to much higher taxonomic resolution with access to trawled specimens, which could be examined under microscope by experts. Given the breadth of taxonomic diversity, expert identifications for all material collected within a reasonable time frame was not possible. Instead we identified everything as belonging to a functional group as per Barnes and Sands (2017) as it provides an ecological context to the diversity that is more meaningful than the higher taxonomic levels of Phylum and Class. The thirteen function groups are defined as follows: suspension feeder pioneers (SP), climax suspension feeders (SC), sedentary suspension feeders (SS), deposit feeding crawlers (DC), deposit feeding vermiform (DV), deposit feeding, shelled burrowers (DS), calcareous grazers (GC), scavenger/predator, sessile soft bodied (PS), scavenger/predator, sessile calcareous (PC), scavenger/predator, mobile soft bodied (PM), scavenger/predator, mobile calcareous (PL), scavenger/predator, arthropod (PA), and flexible strategy (FS) (Table 1). We used previously peer-reviewed methodology (Barnes and Sands, 2017) to estimate the amount of blue carbon stored in ecosystems using a three step process from data collected on the 2015 and 2017 scientific voyages of the RRS James Clark Ross (cruise numbers JR864 and JR16-NG). The first step comprised analysis of the 692 highly accurate (405.7 × 340.6 mm, 12MB, 5 MegaPixel, ±0.1 mm see Supplementary Table S1) images of the seabed to identify animals and their density. Thus for each image the number of specimens of each functional group were recorded, along with the substratum size. This suite of animal identity and density information was collated into a spreadsheet, with a row per image and column per animal identity. To this was added corresponding physical and oceanographic contextual information from multibeam swath and five CTD casts around Ascension and three casts at the seamounts (the positions of CTDs and Agassiz tows are given in Supplementary Table S2). From these depth, sea temperature, salinity, oxygen and chlorophyll content were added and substratum type (Wentworth scale) was added by viewing each image. The shadow length on substrata (in each image) was measured to score rugosity (seabed roughness) on a scale of <1, 1–10, 11–20, 21–30, 31–40, and 41+ mm. To convert densities of functional groups per image to carbon per m2, we first multiplied up the image area to 1 m2, then multiplied these densities by the mean amount of carbon held by each functional group. These mean values were derived by measuring organic content of specimens collected (from collection using a bespoke mini-Agassiz trawl) by weighing after drying them at 70°C for 12 h, and gained ash mass by weight following 480°C incineration for 12 h. We used carbon composition as 50% of organic mass and 12% of carbonate (following Barnes and Sands, 2017). These measures gave a series of carbon masses for each functional group so that mean values could be calculated for each functional group.
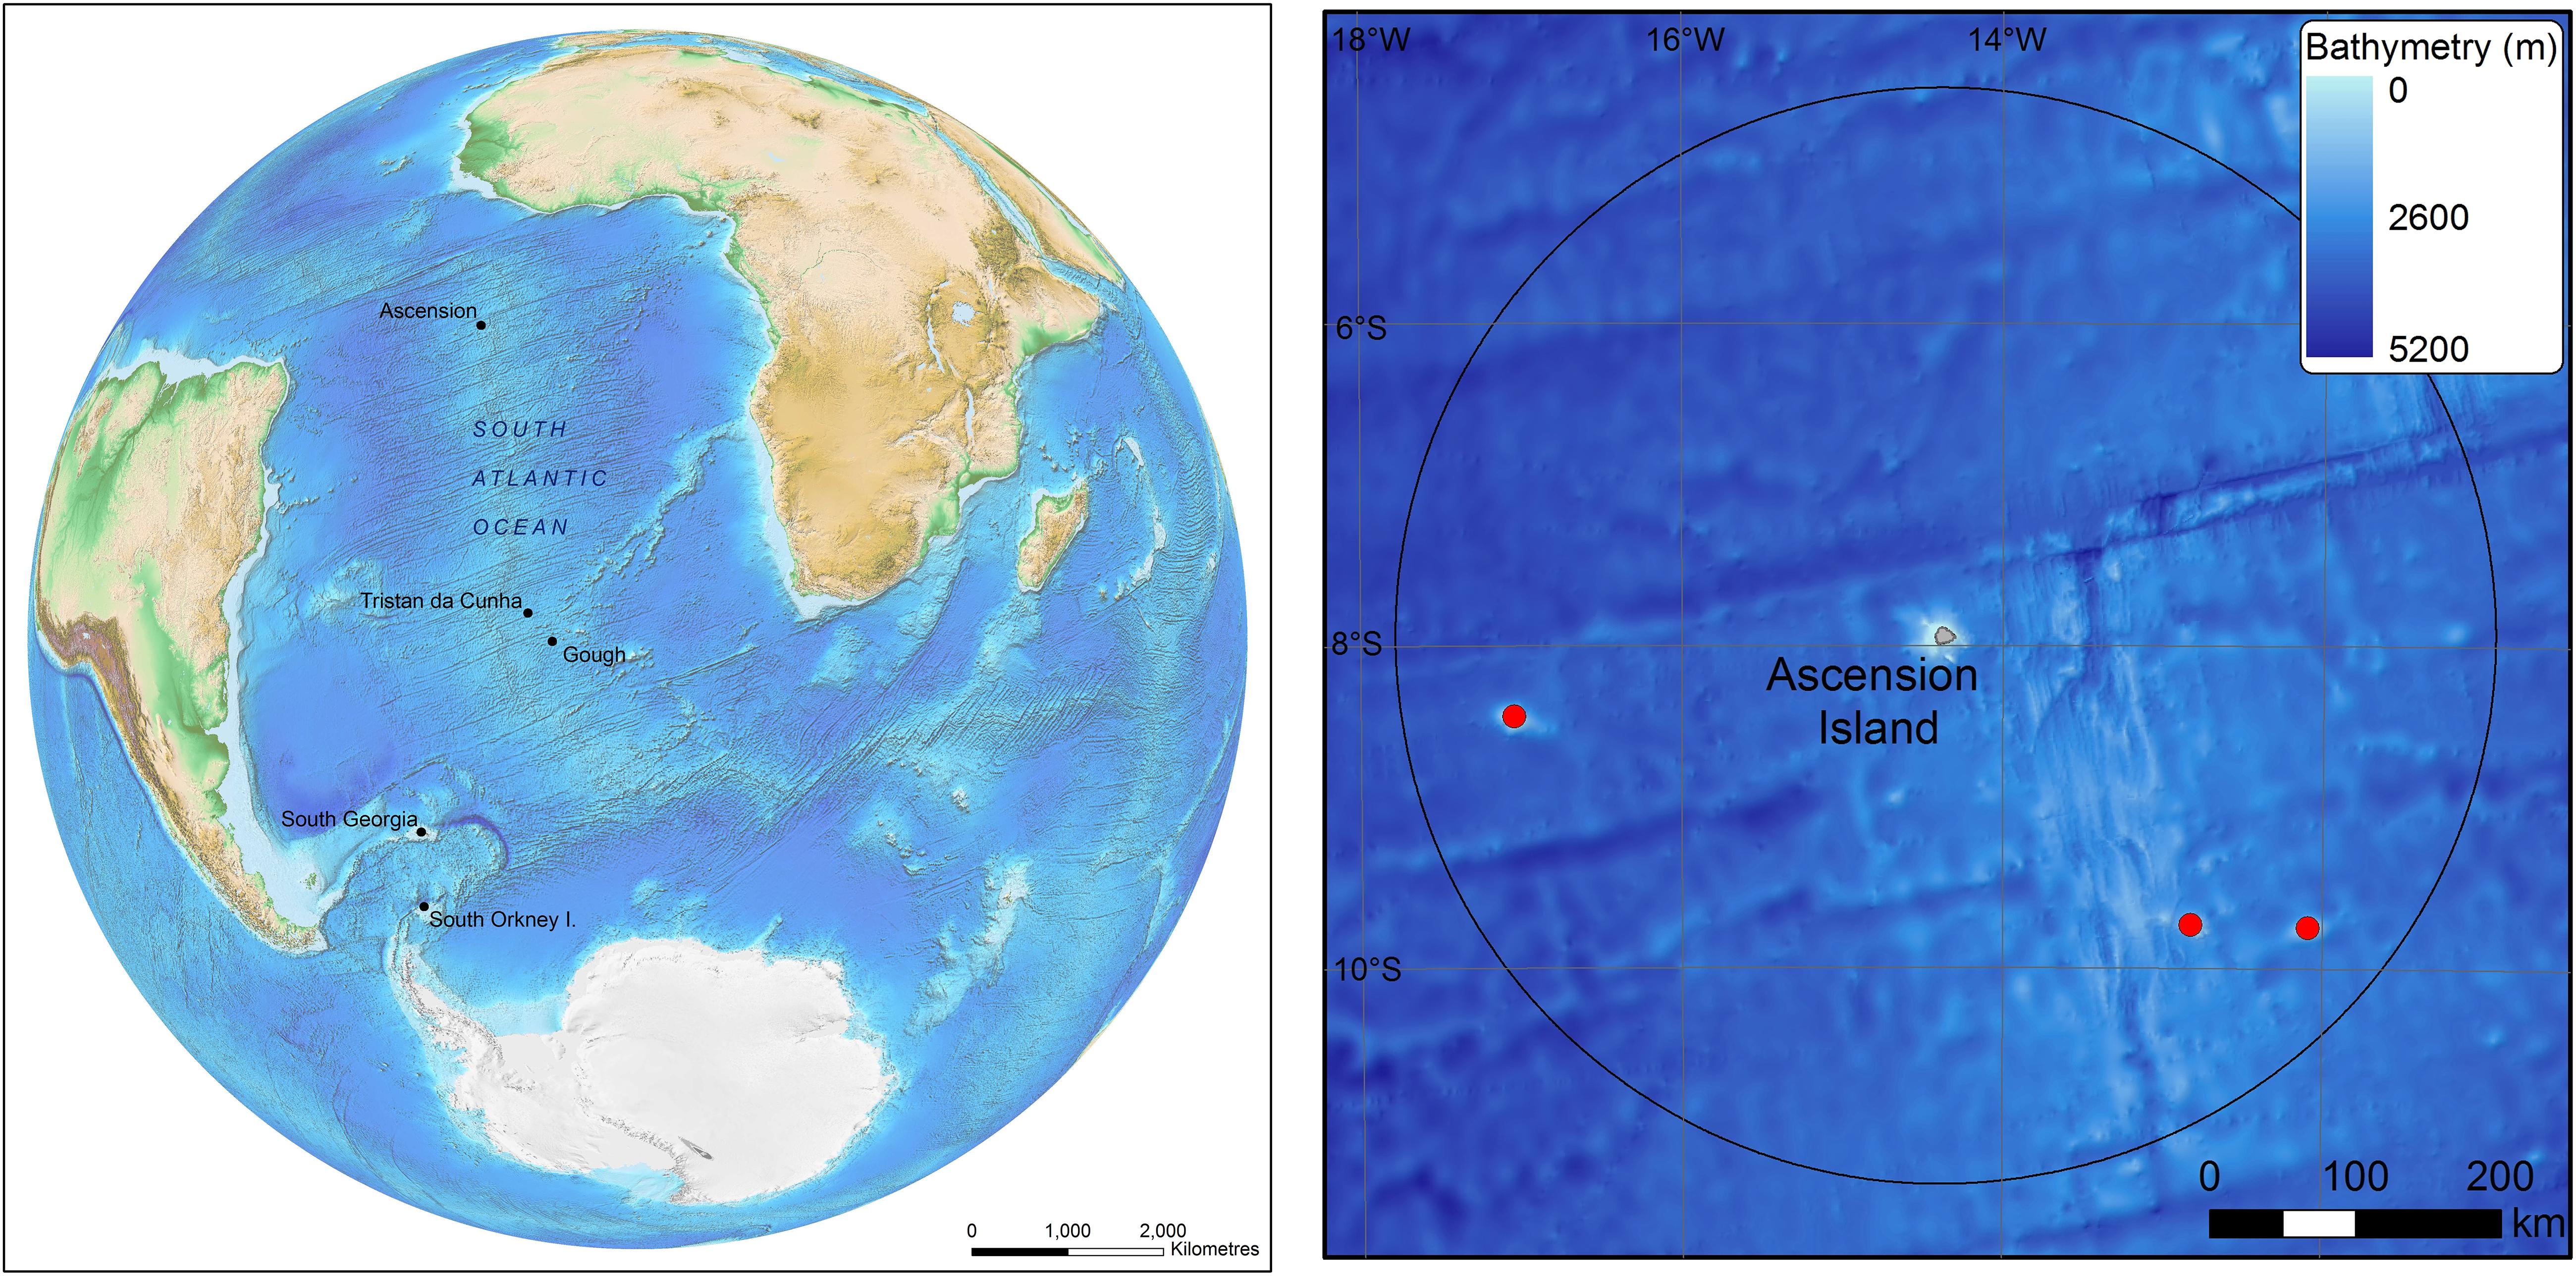
Figure 1. The position of Ascension Island in the South Atlantic (left) and the island and seamounts (red dots) within it’s Exclusive Economic Zone. Bathymetric data is GEBCO held by the British Oceanographic Data Centre (The GEBCO_2014 Grid, version 20150318, www.gebco.net).
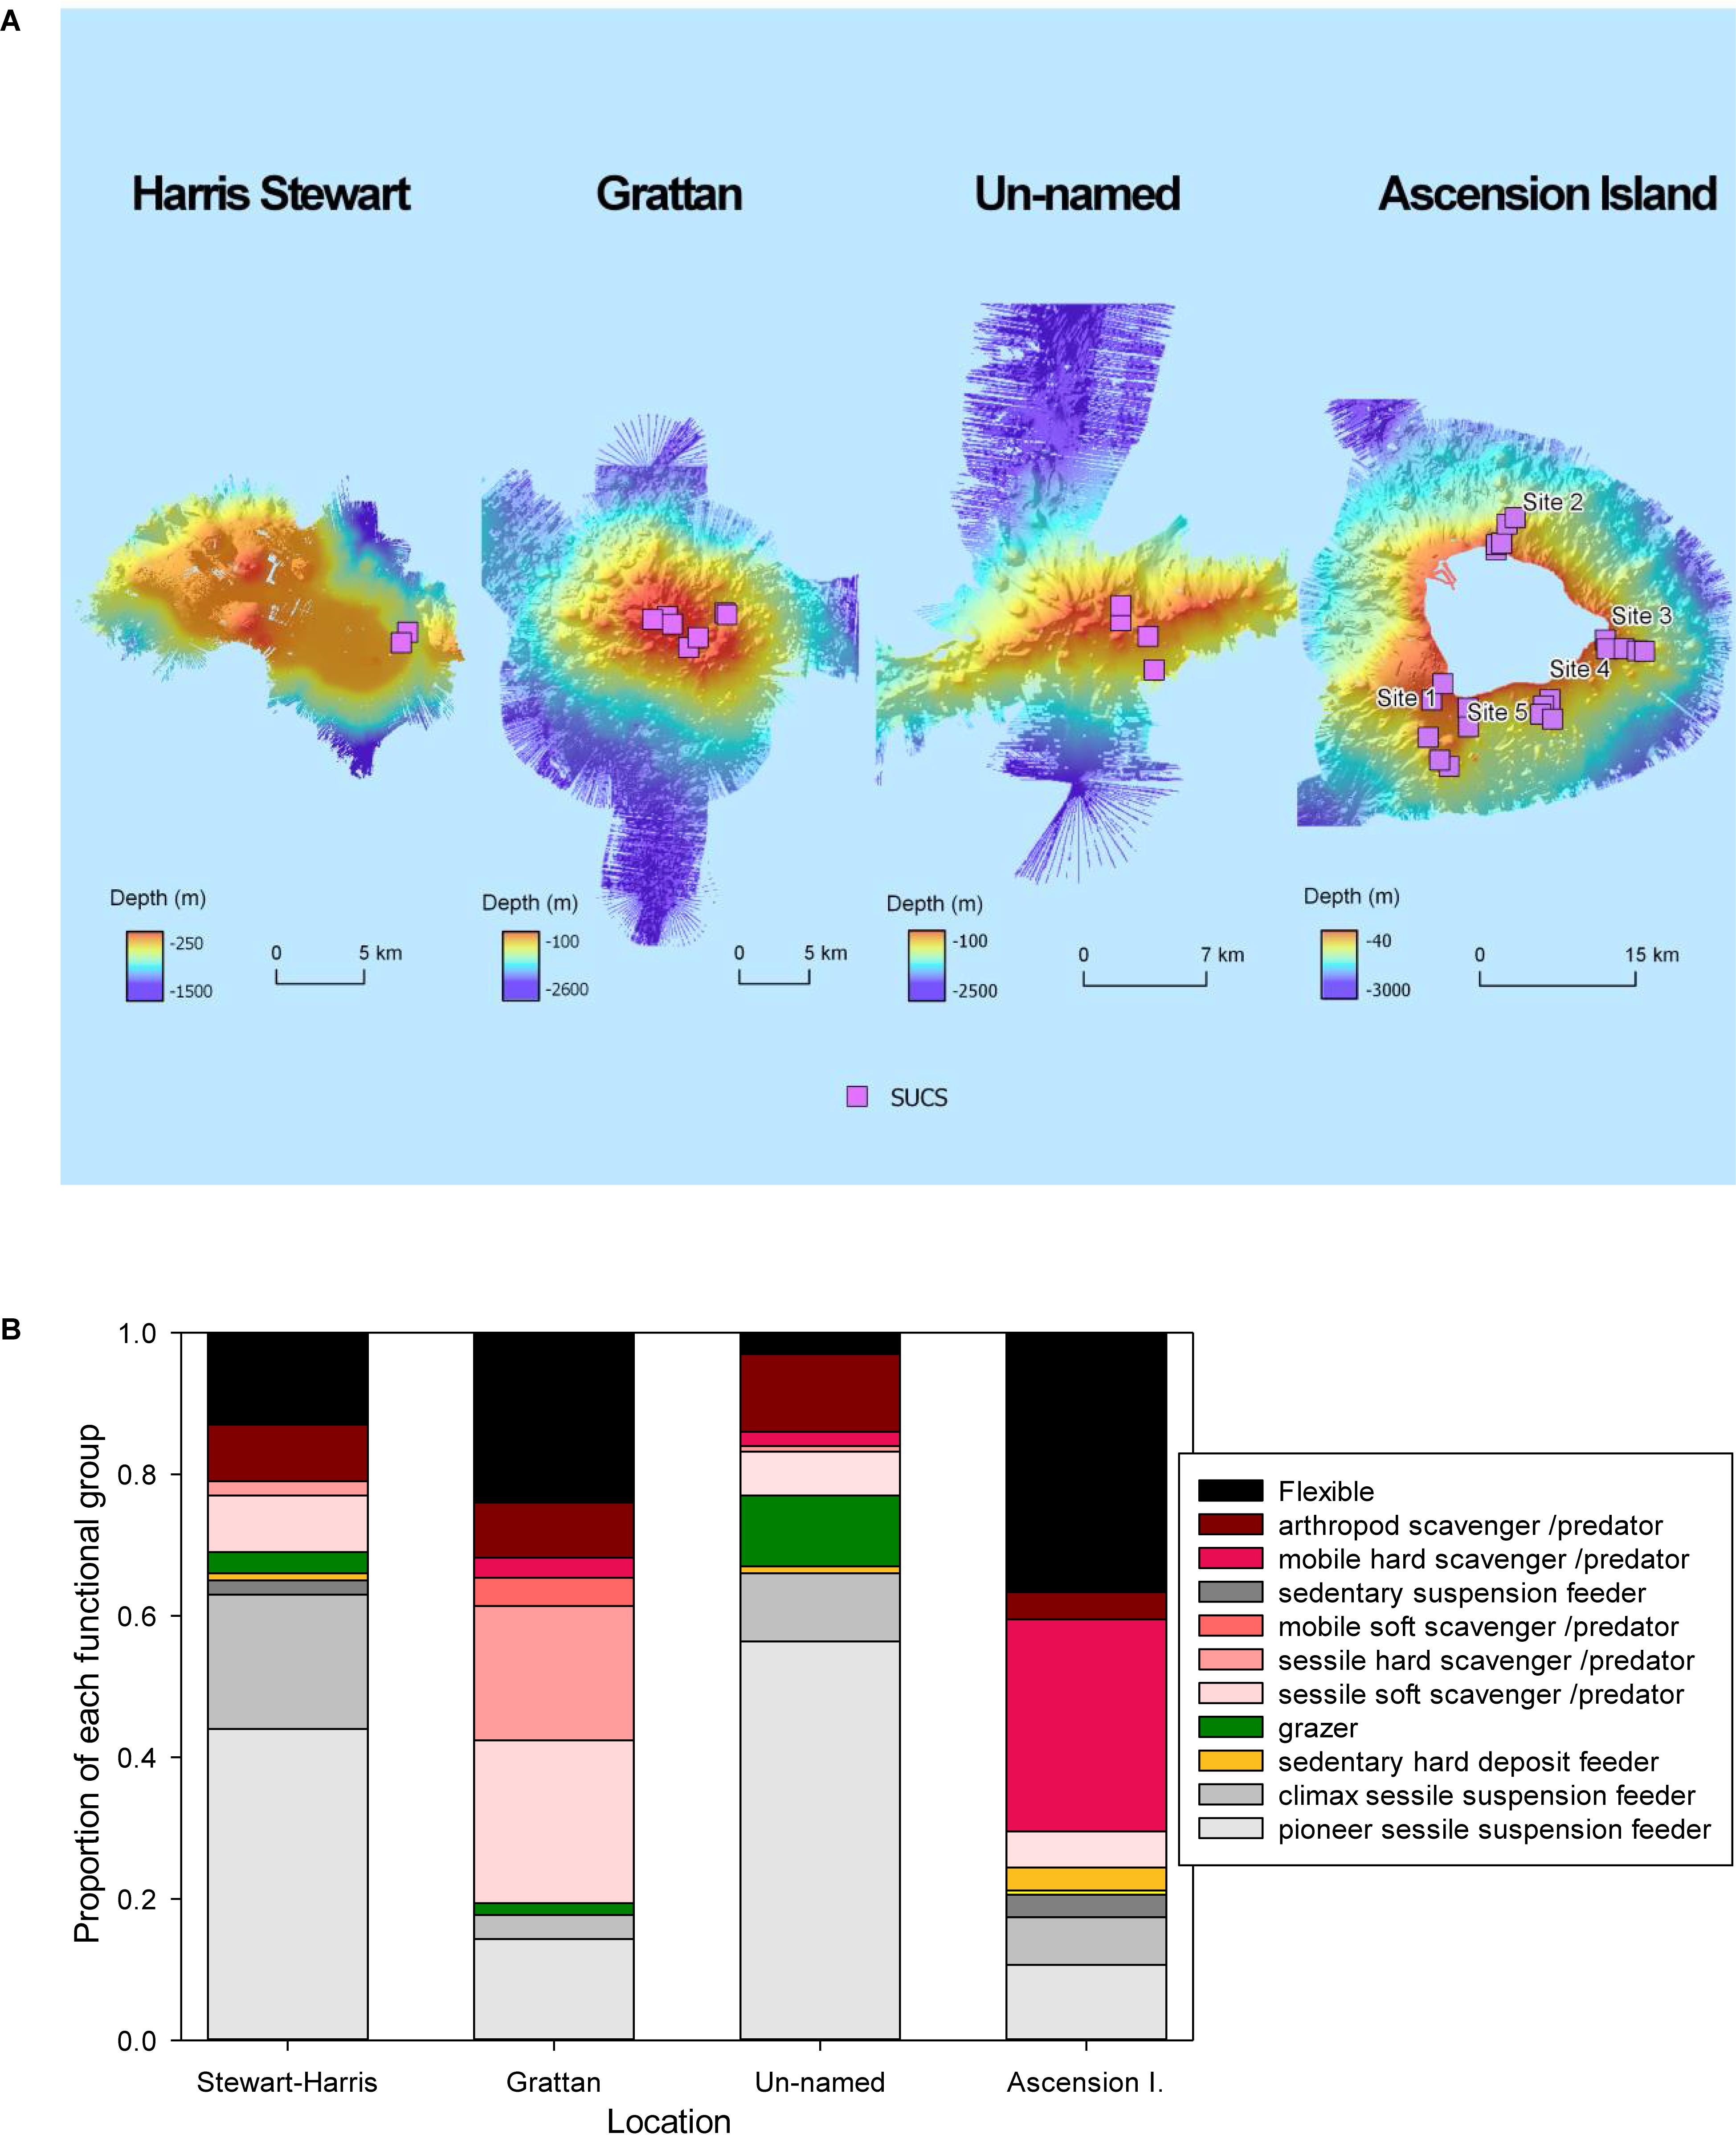
Figure 2. (A) The expeditions of RRS James Clark Ross in 2015 and 2017 were the first to map the seabed around Ascension and it’s EEZ seamounts. The pink squares represent sites where imagery was collected using the Shelf Underwater Camera System (SUCS). (B) The proportion of individuals in images from each functional group per location.
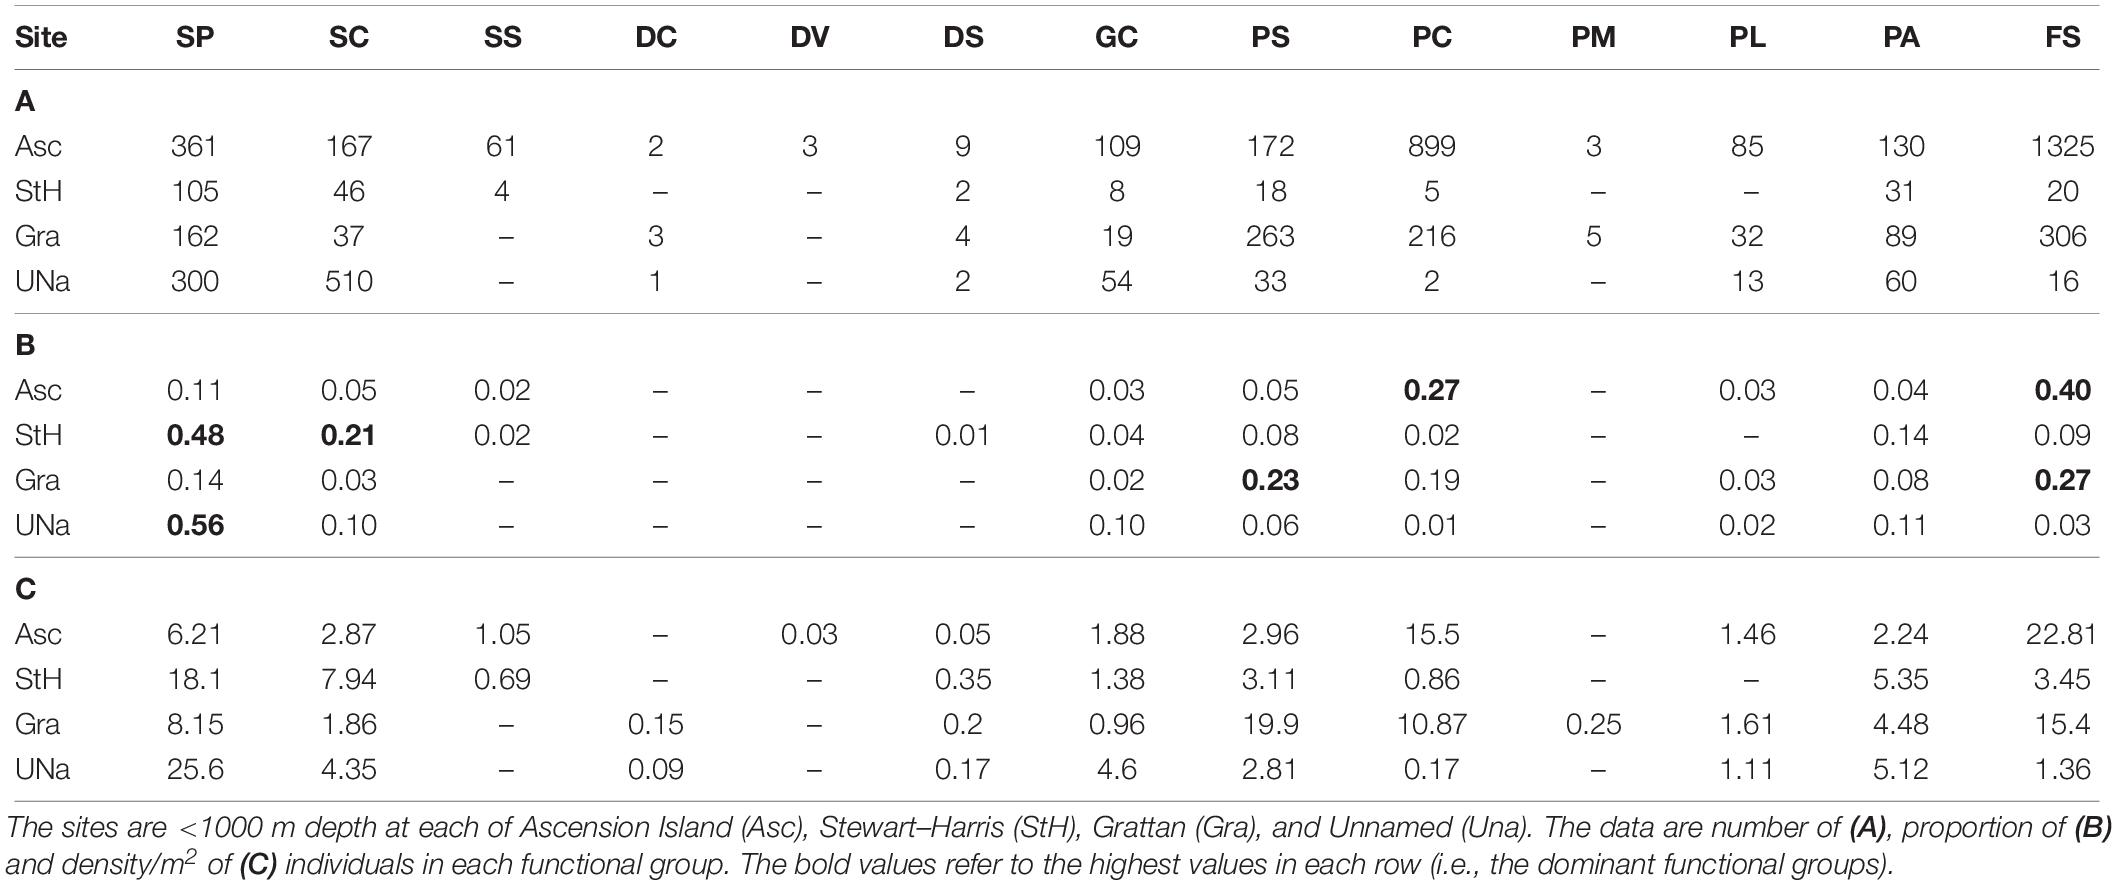
Table 1. Occurrence of each biodiversity functional group by site.
Blue carbon per area data was tested for normality and heterogeneity of variance and then subject to ANOVA to explore which parameters might be driving variability. The ANOVA on the estimated organismal carbon data per image used three factors; rugosity (six levels), site (four levels) and substratum (three levels). The rugosity levels are explained above, the sites were Ascension island and three seamounts and the substratum was hard, soft and mixed. We added 13 rows of data derived from shallow water seabed images (from Barnes, 2015) at the same location to give a sample size of 421 + 271 + 13 = 705. Assemblage structure was explored visually using non-metric Multidimensional Scaling (nMDS) in R [R Core Team (2014). R: A language and environment for statistical computing. R Foundation for Statistical Computing, Vienna, Austria5 ] and the package Vegan (Dixon, 2003).
Functional Groups of Benthos From Images
Our main apparatus was a non-invasive, high resolution, fiber optic SUCS imaging system. This bespoke equipment has an advantage over most other systems of being quantitative and (tested to be) mm accurate over its entire field of view. This is because the camera is; (a) always perpendicular to the seabed, whatever the orientation of the seabed, (b) has a neutral focal length (i.e., not wide or telephoto) and this allows a flat (rather than dome) port to minimize distortion, and (c) the powerful, live controlled dual angle lighting system enables setting a middle aperture diameter (F stop), minimizing lens distortion. These features facilitate accurate measurement in any plane and accurate density determinations. Raw presence numbers for each functional group were standardized (corrected for the total n of benthos sample numbers) into proportion of all benthic fauna (Table 1). These were then further standardized to density/m2 (Table 1).
Scaling Up From Images
We scaled up our blue carbon per area results to the total area < 1000 m deep of Ascension Island and its three seamounts. To do this we used Arcview GIS to calculate the area of seabed (329 km2 around Ascension, 267 km2 of seamounts and just 16 km2 we did not map) using publicly available bathymetry information (held by the British Oceanographic and Polar Data Centres). Estimating sequestration is difficult, especially so from imagery and with large scaling factors, so error could be considerable. Our estimates were driven by chance of burial, so any evidence of this or just nearby sediment was taken into account, as of course was how much of each benthic item was skeleton and what form this takes (e.g., hard coral polyps are more likely to fossilize than sea cucumbers). There are many diverse ways of estimating error associated with such work, one of which is change with increased sampling (particularly pertinent to deep water work, given that we sampled considerably less than 1% of relevant seabed). In our study the last three sites (of 21 at Ascension Island) altered our estimate of sequestered carbon there by ∼3% each, which changed our overall estimate (for all regional seabed < 1000 m) by ∼1.5% each (see Supplementary Table S3).
To calculate scaling factors for zoobenthic blue carbon estimates we first multiplied up the proportion of surveyed seabed at each rugosity level for each location. We assumed that the proportion of these rugosity levels were representative of unsurveyed areas < 1000 m depth. This assumption was made on the basis that increased sample number altered the proportion of rugosity levels by relatively small amounts (6, 3, and 1% change in rugosity estimates by adding last three, last two and last sites to total sites, respectively). So for example 57.5% of Ascension Island’s surveyed seabed < 1000 m depth had a rugosity level of 1–10 mm. Thus we multiplied the total area of Ascension Island’s shelf (328.5 km2) × 0.575 = 188.8 km2 of shelf with this level of rugosity. This was multiplied by mean carbon storage for each rugosity level at each location (Table 6), so for Ascension island’s 1–10 mm rugosity area, this was 188.8 × 40.7 (g m2 or t km2) = 7,687 t km2. This was repeated for each rugosity level at all < 1000 m depth locations.
Results
Thirteen functional groups of benthic organisms were identified in the images recorded by the SUCS. Overall frequencies of each functional group varied considerably between each of the four sites, with more than half of them rare at any site (Table 1). Flexible feeding strategists (many ophiuroids/brittlestars) dominated numbers of benthic organisms around Ascension Island and Grattan seamount, though sessile scavenger/predators such as corals were also very abundant. In contrast sessile suspension feeders (ascidians, bryozoans, brachiopods, some polychete worms and sponges) were the most numerous benthos at Stewart-Harris and Unnamed seamounts. Thus we observed biodiversity was broadly organized into two patterns; brittlestar (FS) and coral (PC) dominated at Ascension Island and Grattan seamount compared to a more mixed suspension feeder assemblage at the other two seamounts investigated. However, images could also be separated into large areas of little apparent zoobenthic carbon, areas of substantial blue carbon in living benthos and lastly banks of blue carbon in dead calcareous skeletons (Figure 3).
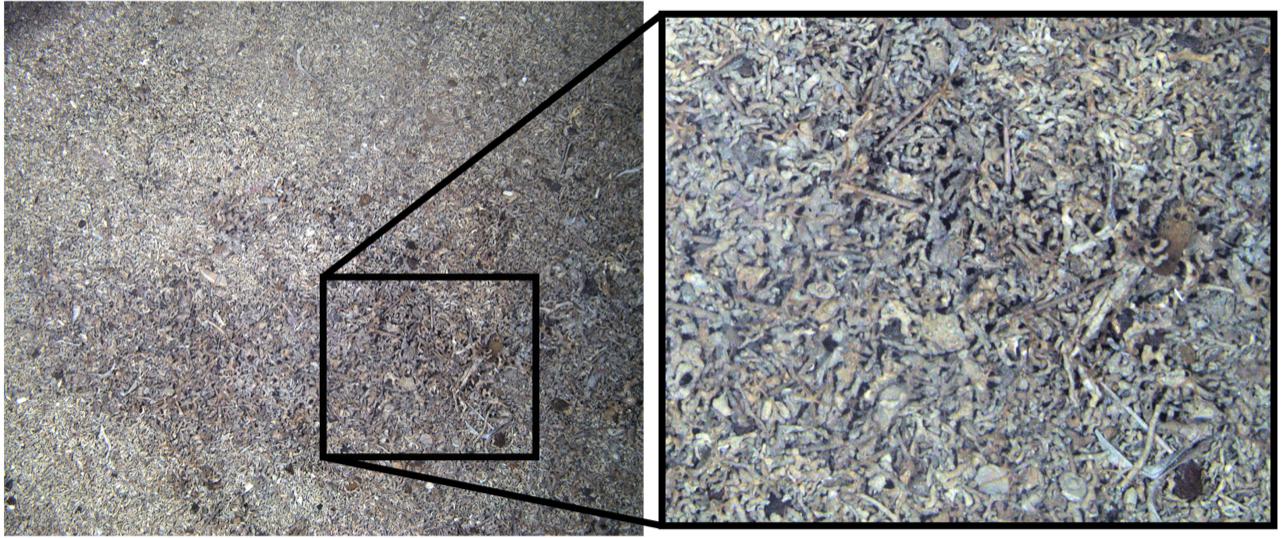
Figure 3. A SUCS image of seabed around Ascension Island’s coast showing extensive build-up of carbonate from dead coral, echinoid echinoderms, sponges, mollusks, and bryozoans.
Using non-metric Multidimensional Scaling (nMDS) showed that two dimensional plots were a reasonable representations of multidimensional structure for each of habitats, sites and substratum rugosity, but a high number of (SUCS) images with no or few faunal components forces the clustering to the center of each plot. What little structure observed was mainly in Ascension Island’s highly rugose rocky environments. Rather than by island/seamount, this density data can be investigated by habitat or other key factors such as seabed rugosity (roughness or level of 3D structuring).
Carbon Storage
We found zoobenthic carbon stored by mean individuals of each functional group across each of the four study sites ranged from 0.02 to 9.8 g (Table 2) with a mean of ∼1.4 g. However, when multiplied by density the most important functional groups were sessile, calcareous predators (corals) at Ascension and Grattan seamount and sessile suspension feeders at Stewart-Harris and Unnamed seamounts (Table 2). Hard corals and sessile suspension feeders accounted for approximately 30–34 and 19–26 g m2 at each of Ascension Island and Grattan seamount vs. the other two seamounts, respectively. These totaled for each site as 41.1–74.6 g per m2 of living fauna (highest around Ascension Island) and a further 4–55 g per m2 in dead calcareous skeletal remains (again highest around Ascension Island). Of the four sites with seabeds shallower than 1000 m, Ascension Island had more stored carbon than the seamounts. Of substrata, hard surfaces had more stored carbon, principally in the form of Lophelia coral outcrops. There were very high levels of variability of zoobenthic carbon storage, within and between study sites, ranging from > 1.2 kg m2 to none per image detectable by imaging. ANOVA of our data showed that whilst site (Ascension and the three seamounts) and substratum type (measured as hard, soft or mixed) were significant terms, most variability was explained by rugosity (Table 3).
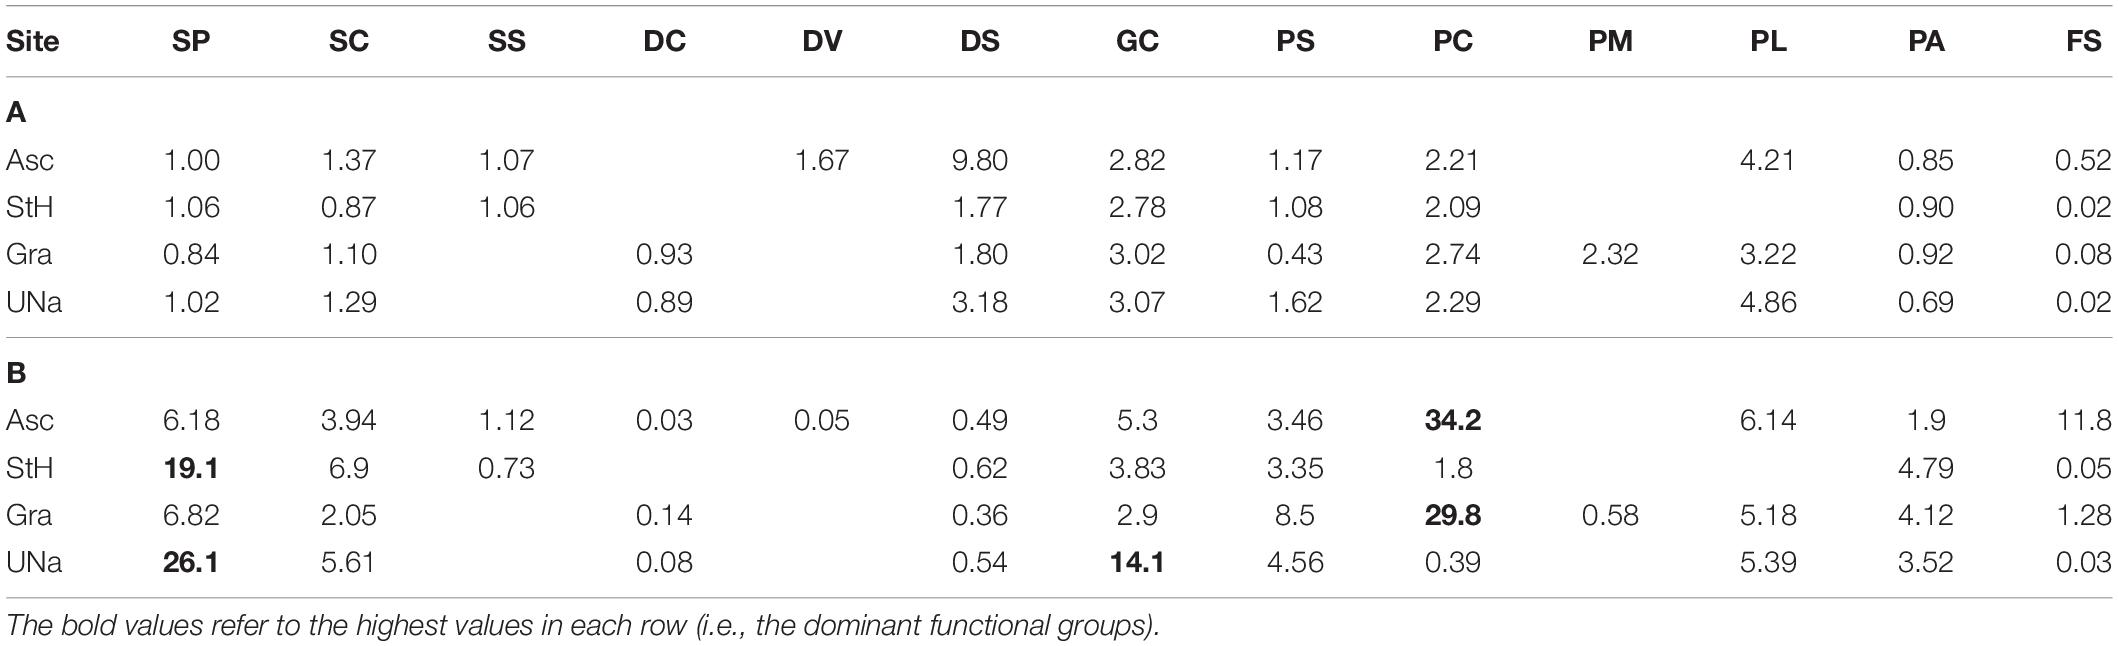
Table 2. Estimates of carbon held by live zoobenthos, in (A) grams per individual and (B) grams per m2 per functional group per site.
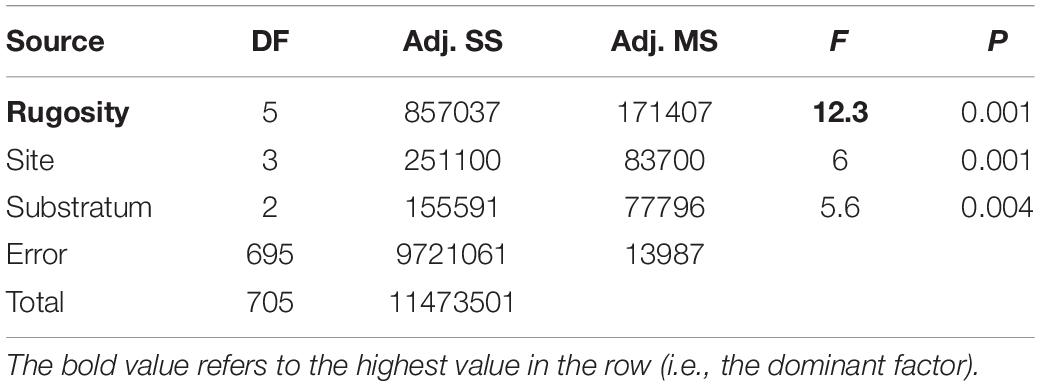
Table 3. ANOVA of zoobenthic carbon storage on Ascension Island seabeds <1000 m deep.
The proportion of area surveyed at each site, of each rugosity type was calculated and this was converted to area (km2) for each surveyed site (columns 3–8 of Table 4). The mean values across the three surveyed seamounts were then scaled up to the total area of all seamount area (row 3 of Table 4). Of the 610.7 km2 total area < 1000 m in depth, Table 4 shows most was of low rugosity. Mean values of blue carbon storage estimates per km2 (shown in Table 5) by rugosity level and site showed how important high rugosity is to blue carbon build-up. Although zoobenthic carbon showed clear increase with seabed rugosity, there was considerable variation at each rugosity level, at both Ascension and the nearby seamounts (Figure 4, upper plots). Mean values of zoobenthic carbon (solid circles, Figure 4) by rugosity level did, however, show a more linear increase.
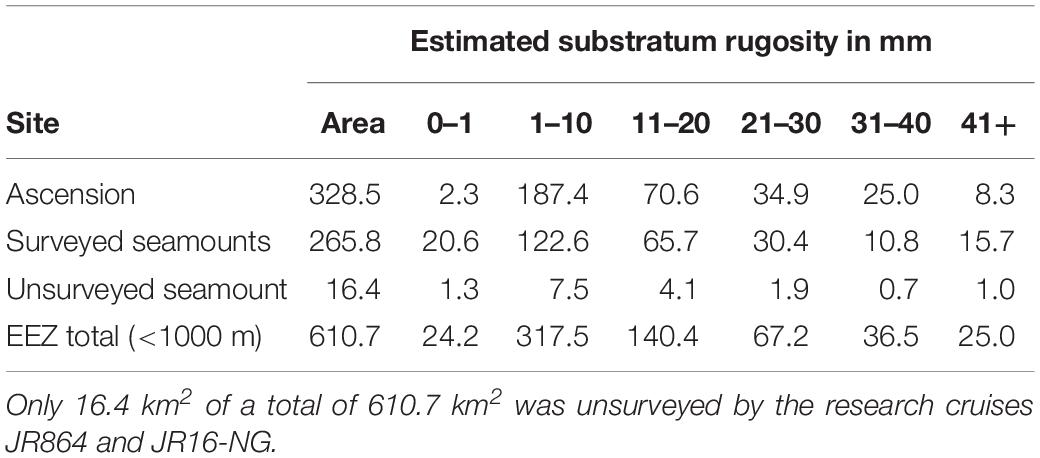
Table 4. Areas in km2 less than 1000 m deep around Ascension by each rugosity level.
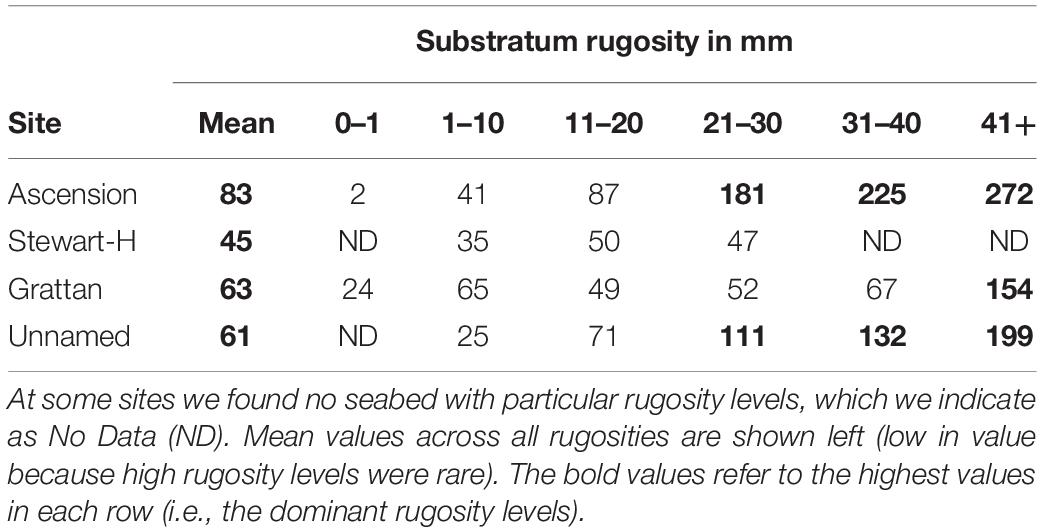
Table 5. Zoobenthic carbon storage by rugosity and area, in tonnes per km2.
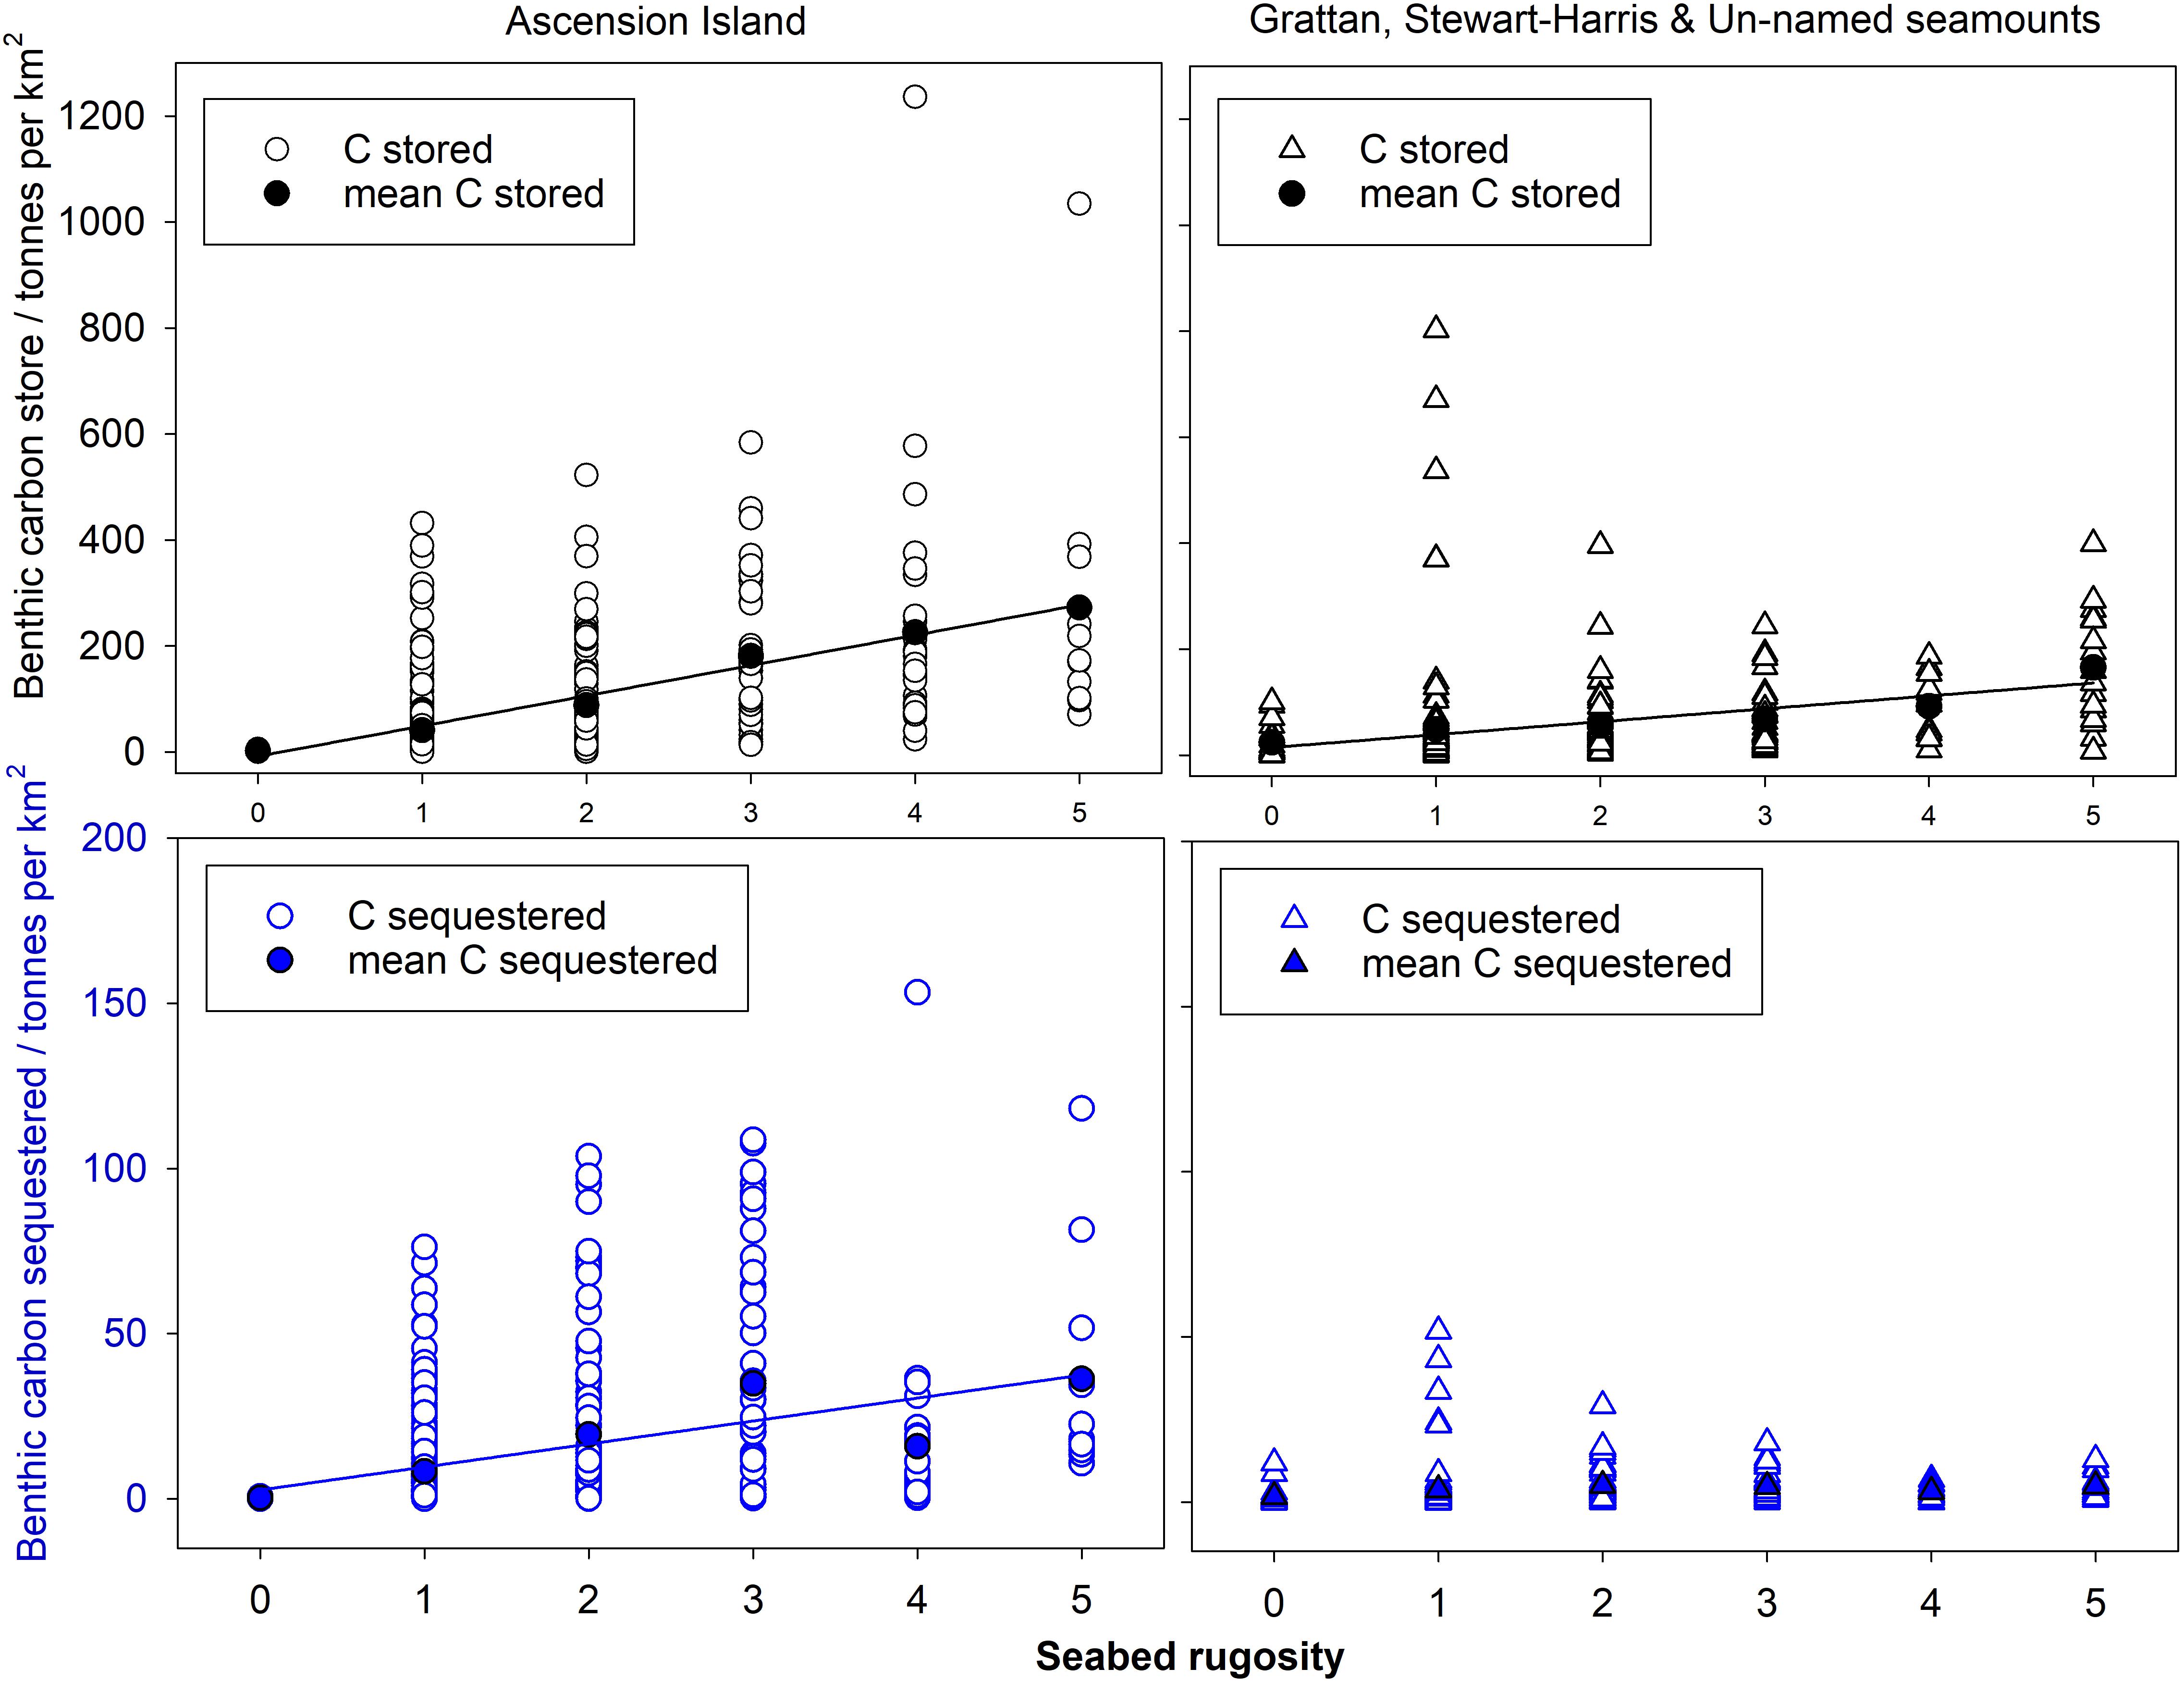
Figure 4. Zoobenthic carbon storage and sequestration with rugosity levels in Ascension Island EEZ waters.
At Ascension we estimated that ∼27% of stored zoobenthic carbon can be considered sequestered locked up for 100+ years (on the basis of how much carbon is in very old corals or dead skeletons). Based on such estimates, similar relationships were apparent between rugosity and carbon sequestration (Figure 4, lower plots) as with storage. No relationships were apparent at site level, probably due to such high variability in sequestration at rugosity level 1 (in turn likely a function of high variation in substratum nature within sites) (Figure 4, lower right plot). This is important because it stopped meaningful analysis using seabed multibeam characteristics (because SWATH data was gridded at 25 m scale).
Scaling Up Carbon Storage to Shelf Areas of Ascension Island’s EEZ
One rugosity level and one site dominated the study samples in the region. Much (52%) of the <1000 m depth seabed we imaged in Ascension Island’s EEZ was low in rugosity (1–10mm). On average we estimate that this supports ∼41 t C km2 (see row 2, column 4, of Table 5) comprising just 29% of total zoobenthic carbon (12,519 t see last row, column 4 of Table 6). More than half of the seabed < 1000 m in Ascension Island’s EEZ is the immediate coast around the main island (53.7%), which supports disproportionally high (65% [27890/43045 see Table 6]) of Ascension’s EEZ benthic blue carbon. Thus substratum rugosity and geography were the key factors behind blue carbon standing stock (Natural Capital).
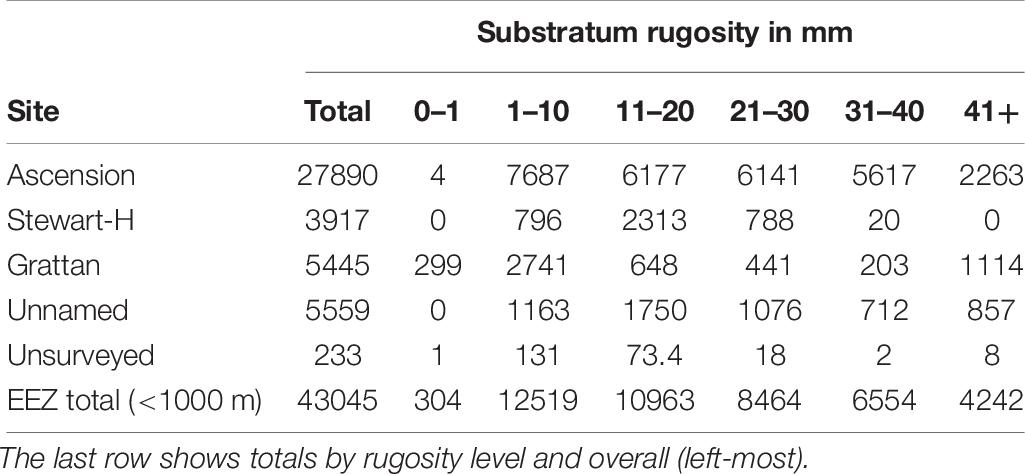
Table 6. Zoobenthic carbon storage by rugosity and area, in tonnes.
Overall we estimate that Ascension Island’s < 1000 m area supports ∼43,000 t of blue carbon (Table 6), mainly as Lophelia cf. pertusa (cold coral) reefs as well as abundant echinoids such as the cidaroid Cidaris cidaris. This standing stock is patchy and sequestration possibilities similarly so, and likely to vary considerably with depth, proximity and nature of soft substrata, and proximity and nature of blue carbon sources. We found that ∼21% of all organismal carbon on the seabed in our samples was held by old living and dead corals or part buried animal skeletons. Our mean estimate of carbon in situ for <100 years (meeting the UN definition for “sequestered”) was thus ∼21% of living standing stock (∼9,000 t C).
Discussion
How Does Ascension Island Blue Carbon Natural Capital Compare With Elsewhere?
As with most work sampling deep water habitats, especially in remote regions, our results from Ascension region involve scaling up from very small sample areas (692 × 0.14 m2), from few sites (21 at Ascension and 13 at the three seamounts). Trailing our camera between actual samples, in live view mode, enabled observation of ∼100 times the sampled area of seabed. During that non-sampled extra seabed observed we saw no obviously new habitats. Our paucity of seabed sampling was also only supported by 8 CTD casts and 13 Agassiz tows, all of which is scant to characterize > 600 km2 of seabed < 1000 m depth. However, the weeks of in situ research time and funding required for a large capable research vessel and crew to be there, and even more to get there, means that this still represents by far the most considerable investigation of deep seabed around Ascension. Whilst small, this was a step change by an order of magnitude in terms of information collected. Ascension’s remoteness and political sensitivity means that more comprehensive deep water sampling may not follow for many decades. Nevertheless it is with this backdrop of uncertainty that any comparisons with more sampled and better known areas must be made.
It is clear from the current study that blue carbon occurring within the top 1000 m of seabed in the Ascension Island EEZ is extremely unevenly distributed across multiple spatial scales, supporting initial observations (Nolan et al., 2017). Within our Ascension EEZ data, the highest levels of variability occurred on the cm to m scale (associated with rugosity). Other important spatial scales were larger at 10s of meters (associated with different substratum types and 10–100 km (associated with seamount/island identity). However, above the spatial scale of Ascension EEZ, that of 1000s of kilometers (associated with different archipelagos and continents) there can be even higher levels of blue carbon variability. This scale is associated with different continents, oceans and major climatic regimes. Overall, the Ascension Island EEZ (<1000 m depth) is estimated to support 70 t carbon km2, an order of magnitude more than the South Orkney Islands (8 t c km2) which are considered as a polar blue carbon hotspot (Barnes et al., 2016). There are few continental shelves where accurate estimates have been produced. Standing stock of shelf around another isolated location, South Georgia (Barnes and Sands, 2017), is probably half that of the South Orkney Islands. Despite being productive, the remotest South Sandwich Islands may have as little as 1% of Ascension EEZ benthic blue carbon per unit area. In terms of stored carbon though it is clearly small in comparison with moderate forests or production of blue carbon in mangroves or kelp forests (Murdiyarso et al., 2015; Krause-Jensen and Duarte, 2016). It may be more important in terms of conversion of blue carbon stored to sequestration. Our estimated value of ∼9,000 t C sequestered for <1000 m depth is low but a high proportion (21%) of standing stock. This does not imply that conversion rate of carbon storage to carbon sequestration is 21%. Conversion rate is likely to be much lower (possibly by an order of magnitude). Much of the carbon that we consider sequestered could have been there for hundreds or even thousands of years, so it is a cumulative build up. Much of the fast growth is by organisms less likely to sequester, either because they are in high energy habitats of the shallows or because they mainly comprise soft tissues which are easily consumed on death by other macrobes or broken down in the microbial loop (and thus the carbon is recycled rather than sequestered). However, our 9,000 t C total value of sequestered carbon is likely to be a considerable underestimate, because it does not take into account sequestration of primary or secondary production into >1000 m depths.
What Is the Magnitude of Ongoing Blue Carbon Ecosystem Services?
The current study estimated standing stock or natural capital of existing zoobenthic blue carbon around Ascension island’s <1000 m depth zone. In addition to standing stock information, estimation on ongoing carbon storage requires growth performance data or key zoobenthos store and sequesters, and environmental horizon scanning (for change in likely conditions influencing performance). Various literature has estimated growth rates of calcifying benthos such as corals, and shown that they vary considerably even within species between locations, depths and water masses (Vecsei, 2004; Van Oevelen et al., 2009; Roberts et al., 2010; Sabatier et al., 2012). We used a conservative estimate of 0.1 g.m–2.day–1 across benthic taxa, which in line with cold coral literature is slow compared to global mean reef production 2.5–7.4 g.m–2.day–1 (Vecsei, 2004) or 2.2 g.m–2.day–1 of the nearest Caribbean reefs (Mallela, 2013). The value of 0.1 g carbon m–2.day–1 was only applied to seabed areas which had at least 10 g carbon living zoobenthic estimated standing stock. However, using this as a whole environment carbon accumulation rate has several problems, all of which are underestimates. This value does not include near surface primary production standing stock or sequestration export nor does it include the nearshore faunal standing stock or export, which we estimate to be in the region of ∼18 g carbon m2 (see accompanying Excel worksheet) and is likely to grow very much quicker (Vecsei, 2004; Mallela, 2013). Thus our production estimation is very conservative.
We estimated that 506 of the 692 SUCS images contained less than 10 g C m2 of live fauna. Thus we considered that only 692 − 506 = 186 of the 692 were significant generators of blue carbon. We thus applied our growth rate (0.1 g.m–2.day–1) to 186/692 = 26.9% of Ascension Island’s < 1000 m depth area (610.7 km2); 0.269 × 610.5 = 164.3 km2. The calculation we used was thus 0.1 t Carbon km2 × 164 km2 × 365 (days) = blue carbon stock generation = ∼6000 t.yr–1 in the < 1000 m area of the Ascension Island EEZ. Our estimate of 6000 t.yr–1 of sequestered carbon for the area <1000 m deep in Ascension Island’s EEZ is equivalent to ∼14% of our blue carbon standing stock estimate in that same area.
Geographic Variability in Blue Carbon and Drivers Influencing This
The productivity, standing stock and drivers of blue carbon sinks are likely to vary in many different ways, even within a single “type” such as kelp forests (Bell et al., 2015). The current work only investigated blue carbon over a wider and deeper bathymetric range than most literature (but see Armstrong et al., 2012), yet still constituted a mere 1% of Ascension Island’s EEZ. Assuming that the abyssal seabed around Ascension is typical, it is likely to be very low in biomass and blue carbon per unit area. Thus the Ascension EEZ well illustrates the extremes of geographic variability in blue carbon distribution. As much as 99% of Ascension EEZ could be within the <1% of the seabed shallower than 1000 m. Even within that, most blue carbon seems to be around Ascension Island’s coast and, even within that, most is associated with the 10% of the seabed which is rough and complex. We found areas where there was three orders of magnitude variability in estimated blue carbon standing stock within tens of meters apart.
The extreme variability over multiple spatial scales makes isolating which factors are causal of variation extremely challenging. However, the location and nature of most of the dead calcareous skeletal remains (mainly around Ascension Island), suggests that there has not been considerable temporal variation, unlike other blue carbon sources (e.g., Krumhansl et al., 2016). Likewise the growth rate estimates suggests slow growth and build-up of the cold coral reefs in Ascension Island waters. We think that the prevailing reasons for such sparse and patchy blue carbon are (1) isolation from nearest larval supply and (2) recruitment conditions for young. Isolation is important because Ascension and its associated seamounts are far apart, and all very far apart from other nearest adult concentrations for larval supply. This is exacerbated by them being small in area and relatively young. Thus local retention of larvae is probably very important to development of biomass and thereby blue carbon, but during the process of SUCS image capture we observed considerable water movement across all depths and locations. In addition to high water movement, imaging using SUCS showed some sand at every site and location. Thus recruitment conditions involve unstable soft sediments and “sand blasted” hard surfaces, which may be partly why rugosity emerged as such a strong factor. Roughness slows water down (allowing larvae to settle) and provides protection from particles being driven against surfaces by current. We think most areas of blue carbon importance establish and develop close to adult supply sources (i.e., downstream of previous or current biomass) where the seabed is rough to maximize recruitment success.
Neither temperature nor a proxy of primary production (phytoplankton) emerged as explanatory factors, however, there is good reason to suspect that both of these could still be important drivers but complicated and confounded in various ways. High marine biomass is typically associated with coral reefs, which in Ascension EEZ are in shallow warm waters but also in deep cold waters. However, that is only where there is enough hard surface to establish and even then only (perhaps by chance) in some of those areas (Nolan et al., 2017). Where shelf seabeds are in contact with phytoplankton blooms, such as round Ascension Island’s coast they can be very important for suspension feeders and their predators (but not so much for many other carbon rich benthos). However, the depth of algal blooms vary between locations and strongly with time. Our two surveys were both far too brief to establish durations, depths and nature of these blooms.
Threats to Ascension Island’s Biodiversity and Blue Carbon
Marine biodiversity and blue carbon ecosystem services face very considerable, increasing and diverse threats (Ling et al., 2009; Krumhansl et al., 2016; Barnes et al., 2018a). We considered three main threats to Ascension Island EEZ’s biodiversity and blue carbon ecosystem services, how to monitor for these and any potential mitigation. It was not apparent from our 2015 and 2017 surveys that there were immediate strong impacts or threats (Nolan et al., 2017). However, given the remote nature of the seabed we surveyed, most of the threats are likely to be quite diverse and global in nature. Local threats to blue carbon are likely to only influence marine life around the main island of Ascension’s coast (rather than beyond to seamounts).
Despite small population and remoteness, pollution is a consideration. For example plastic pollution was evident on the sea surface and seabed, and there is evidence that is increasing considerably (Barnes et al., 2018b). Plastic entanglement of coral was seen, albeit only apparent in 0.5% of samples. Plastic can mechanically damage biota, increase disease susceptibility and decrease efficiency and slow growth through being ingested. Whilst this appears to be an increasing issue in Ascension waters, most have no local source nor obvious solution (although nearby landfill sites could be made more secure to wind blowing material into the nearby ocean). Refueling and human coastal use also provide some pollution threat, mainly to shallow coral assemblages in bays.
As with many remote locations much of the increasing threat is climate change related in the form of pH decrease (acidification), temperature stress and other physio-chemical ocean change. Whilst thermal tolerance issues are probably most severe for shallow biota, acidification is probably the most serious issue for most blue carbon storing biodiversity, not least because of reduced sequestration potential. Even if organisms can buffer decreased pH whilst alive (at the cost of somatic growth or reproductive potential), the chances of burial of their carbon stored are reduced because of increased dissolution, and large build-ups of ancient calcareous reef remains will be increasingly dissolved.
Across oceans the drastic reduction of fish populations through fishing, and bycatch from bottom fishing or birds near the surface is a major, long-recognized and rising problem (Jackson et al., 2001). There are few coastal environments on the planet where fishing would not be high amongst threats but around Ascension it is unlikely that regional fishing provides much threat since it is small scale and pelagic, apart from gear loss (plastic pollution). Although gear loss (ghost fishing) has been found around other Atlantic Islands and seamounts we did not encounter any on our 2015 and 2017 surveys. Best practice for monitoring blue carbon (high carbon storing biodiversity) health and performance is likely to be through regular surveys, by SCUBA in shallows and research ship in deeper waters. These are expensive financially, in time and expertise, and deeper work would require multibeam, deep cameras and limited targeted physical collections (to monitor temporal growth effects) but there are few such vessels passing Ascension Island. Furthermore we could not find multibeam (SWATH) signatures for centers of blue carbon interest (for example Topographic Position Index) at 25 m data gridding scale (Nolan et al., 2017). The resolution of such systems at that depth make them unlikely to provide rapid “remote” monitoring solution. Monitoring and stewardship of blue carbon has costs but this ecosystem itself has a calculable value in societal benefit, and estimating this provides context against costs and shows return for conservation (Zarate-Barrera and Maldonado, 2015; Barnes et al., 2016).
What Is the (Shadow Carbon Cost) Value of Sequestration by Ascension EEZ’s Marine Life?
There is a very wide range of estimate methods and thus estimates for Social Cost of Carbon (SCC) and shadow price of carbon (SPC) between nations, years, discount rate and even models. We report using 2019 values in £ GBP Sterling, based on the High level commission on Carbon prices6. This places a value of approximately US$39–78 per tonne CO2 in 2019. In United Kingdom, these translate to GBP £29–59 per tonne CO2 (2019). It is important to note that this value increases considerably with time so that any value presented in this report needs to be rescaled for any year it is read other than 2019.
We estimate that blue carbon storage by marine biodiversity in <1000 m depth across Ascension Island’s EEZ totals at ∼43,000 t (∼28,000 t around Ascension Island and 15,000 t around the three offshore seamounts). This 43,000 t of blue carbon stock held by benthic biodiversity there is estimated to capture an additional 6,000 t per year (but will also have losses in respiration and microbial breakdown). We estimate that ∼21% of that stored zoobenthic carbon can be considered sequestered (9,000 t). 43,000 t C is equivalent of 158,000 t CO2 and the fully sequestered 9,000 t C is equivalent to 33,070 t CO2. Thus the 2019 lower value of this blue carbon sequestered is 33,070 × 29 = £960,000 and the upper value is £1.9 million. Each year this value increases with both increased value of carbon but also annual increment of carbon deposition, such that 2030 lower and upper values of sequestered blue carbon are estimated to be £2.1–£4.3 million. This valuation does not take into account if there is any underlying trend in the change of rates of sequestration (e.g., increase or decrease in blue carbon capture, storage and sequestration is response to physical changes in the environment). Monitoring using data here as baseline should be able to address this potential source of error. Total valuation did not include the surrounding deep seabed production and sequestration, yet that is by far most of Ascension Island’s EEZ. Deep water blue carbon storage is little known anywhere in the world and unmeasured around Ascension but even if it is only 5% of that above 1000 m, it would double the total value of the EEZ standing stock.
Countries which commit to protecting and improving their ecosystems that act as carbon sinks are able to access international carbon mitigation financing streams such as Reducing Emissions through Decreased Deforestation (REDD +)and National Appropriate Mitigation Actions (NAMAs) as well as to implement programs and policies at a national level. Whilst most of these schemes are terrestrially based, there are promising market mechanisms for marine – or “Blue Carbon” – trading including the United Nations Framework Convention on Climate Change (UNFCCC) and EU Emissions Trading System (Roger Ullman et al., 2013). In the United Kingdom, the Shelf Sea Biogeochemistry Research Programme is exploring how carbon credits could be implemented through the amount of carbon stored within its territorial waters. In protecting its benthic carbon through the designation of its VLMPA, Ascension Island Government could potentially draw on these future Blue Carbon trading mechanisms.
Data Availability Statement
The datasets generated for this study are available on request to the corresponding author.
Author Contributions
All authors were involved conceptually in the project and contributed to the writing of the manuscript. DB and CS led the fieldwork and analysis. AR contributed to the lab work.
Funding
National Geographic Pristine Seas funded one of the two expeditions, whilst Blue Marine Foundation funded the other. JNCC and SAERI commissioned and funded the analyses.
Conflict of Interest
The authors declare that the research was conducted in the absence of any commercial or financial relationships that could be construed as a potential conflict of interest.
Acknowledgments
We thank the Foreign and Commonwealth Office (FCO) which managed Conflict, Stability and Security Fund (CSSF), and Joint Nature Conservation Committee (JNCC) for funding analyses. We would also like to thank the National Geographic Pristine Seas, Blue Marine Foundation, and the Natural Environment Research Council for funding the two field expeditions. Finally, we thank the officers and crew of RRS James Clark Ross for all their tireless effort in helping to make JR864 and JR16-NG so successful.
Supplementary Material
The Supplementary Material for this article can be found online at: https://www.frontiersin.org/articles/10.3389/fmars.2019.00663/full#supplementary-material
Footnotes
- ^ See e.g., www.ecosystemvaluation.org, www.openchannels.org, www.naturalcapitalproject.org.
- ^ http://thebluecarboninitiative.org/
- ^ http://jncc.defra.gov.uk/page-7443
- ^ https://www.gov.uk/government/publications/the-blue-belt-programme
- ^ http://www.R-project.org/
- ^ https://static1.squarespace.com/static/54ff9c5ce4b0a53decccfb4c/t/59244eed17bffc0ac256cf16/1495551740633/CarbonPricing_Final_May29.pdf
References
Adams, W. M. (2014). The value of valuing nature. Science 346, 549–551. doi: 10.1126/science.1255997
Armstrong, C. W., Foley, N. S., Tinch, R., and van den Hove, S. (2012). Services from the deep: steps towards valuation of deep sea goods and services. Ecosyst. Serv. 2, 2–13. doi: 10.1016/j.ecoser.2012.07.001
Balmford, A., Bruner, A., Cooper, P., Costanza, R., Farber, S., Green, R. E., et al. (2002). Economic reasons for conserving nature. Science 297, 950–953. doi: 10.1126/science.1073947
Barnes, D. K. A. (2015). Antarctic sea ice losses drive gains in benthic carbon drawdown. Curr. Biol. 25, R789–R790. doi: 10.1016/j.cub.2015.07.042
Barnes, D. K. A., Fleming, A., Sands, C. J., Quartino, M. L., and Deregibus, D. (2018a). Icebergs, sea ice, blue carbon and antarctic feedbacks. Phil. Trans. R. Soc. A 376:20170176. doi: 10.1098/rsta.2017.0176
Barnes, D. K. A., Ireland, L., Hogg, O. T., Morley, S., Enderlein, P., and Sands, C. J. (2016). Why is the south orkney island shelf (the world’s first high seas marine protected area) a carbon immobilization hotspot? Glob. Change Biol. 22, 1110–1120. doi: 10.1111/gcb.13157
Barnes, D. K. A., Morley, S. A., Bell, J., Brewin, P., Brigden, K., Collins, M., et al. (2018b). Marine plastics threaten giant Atlantic marine protected areas. Curr. Bio. 28, R1121–R1122. doi: 10.1016/j.cub.2018.08.064
Barnes, D. K. A., and Sands, C. J. (2017). Functional group diversity is key to Southern ocean benthic carbon pathways. PLoS One 12:e0179735. doi: 10.1371/journal.pone.0179735
Bell, T. W., Cavanaugh, K. C., Reed, D. C., and Siegel, D. A. (2015). Geographical variability in the controls of giant kelp biomass dynamics. J. Biogeog. 42, 2010–2021. doi: 10.1111/jbi.12550
Constanza, R., d’Arge, R., de Groot, R., Farber, S., Grasso, M., Hannon, B., et al. (1997). The value of the world’s ecosystem services and natural capital. Nature 387, 253–260. doi: 10.1126/sciadv.1601880
de Groot, R., Brander, R., van der Ploeg, S., Costanza, R., Bernard, F., Braat, L., et al. (2012). Global estimates of the value of ecosystems and their services in monetary units. Ecosyst. Serv. 1, 50–61. doi: 10.1016/j.ecoser.2012.07.005
Dixon, P. (2003). VEGAN, a package of functions for community ecology. J. Veg. Sci. 14, 927–930. doi: 10.1111/j.1654-1103.2003.tb02228.x
Duarte, C. M., Middelburg, J. J., and Caraco, N. (2005). Major role of marine vegetation on the oceanic carbon cycle. Biogeosciences 2, 1–8. doi: 10.1371/journal.pone.0052932
Foley, N., van Rensburg, T., and Armstrong, W. C. (2010). The ecological and economic value of cold-water coral ecosystems. Ocean Coast. Manag. 53, 313–326. doi: 10.1016/j.ocecoaman.2010.04.009
Fremand, A., and Barnes, D. (2019). A Bathymetric Compilation of Ascension Island, 2000-2017 (Version 1.0) [Data Set]. UK Polar Data Centre. Natural Environment Research Council, UK Research & Innovation. Available at: https://doi.org/10.5285/afba710f-dab1-4a63-867b-520177388224
Jackson, J. B. C., Kirby, M. X., Berger, W. H., Bjorndal, K. A., Botsford, L. W., Bourque, B. J., et al. (2001). Historical overfishing and the recent collapse of coastal ecosystems. Science 293, 629–638.
Jobstvogt, N., Townsend, M., Witte, U., and Hanley, N. (2014). How can we identify and communicate the ecological value of deep-sea ecosystem services? PLoS One 9:e100646. doi: 10.1371/journal.pone.0100646
Krause-Jensen, D., and Duarte, C. M. (2016). Substantial role of macroalgae in marine carbon sequestration. Nat. Geosci. 9, 737–742. doi: 10.1007/s13280-016-0849-7
Krumhansl, K. A., Okamoto, D. K., Rassweiler, A., Novak, M., Bolton, J. J., Cavanaugh, K. C., et al. (2016). Global patterns of kelp forest change over the past half-century. Proc. Natl. Acad. Sci. U.S.A. 113, 13785–13790.
Ling, S. D., Johnson, C. R., Frusher, S. D., and Ridgway, K. R. (2009). Overfishing reduces resilience of kelp beds to climate-driven catastrophic phase shift. Proc. Natl. Acad. Sci. U.S.A. 106, 22341–22345. doi: 10.1073/pnas.0907529106
Mallela, J. (2013). Calcification by reef-building sclerobionts. PLoS One 8:e60010. doi: 10.1371/journal.pone.0060010
Murdiyarso, D., Purbopuspito, J., Kauffman, J. B., Warren, M. W., Sasmito, S. D., Donato, D. C., et al. (2015). The potential of Indonesian mangrove forests for global climate change mitigation. Nat. Clim. Change 5, 1089–1092. doi: 10.1186/s13021-017-0080-2
Nolan, E. T., Barnes, D. K. A., Brown, J., Downes, K., Enderlein, P., Gowland, E., et al. (2017). Biological and physical characterization of the seabed surrounding Ascension Island from 100–1000 m. J. Mar. Biol. Ass. U.K. 97, 647–659. doi: 10.1017/S0025315417000820
R Core Team (2014). R: A Language and Environment for Statistical Computing. Vienna, Austria: R Foundation for Statistical Computing. Available at: http://www.R-project.org/
Roberts, J. M., Wheeler, A. J., Freiwald, A., and Cairns, S. J. (2010). Cold-Water Corals. The Biology and Geology of Deep-Sea Coral Habitats. Cambridge: Cambridge University press.
Roger Ullman, R., Bilbao-Bastida, V., and Grimsditch, G. (2013). Including blue carbon in climate market mechanisms. Ocean Coast. Manag. 83, 15–18. doi: 10.1016/j.ocecoaman.2012.02.009
Sabatier, P., Reyss, J.-L., Hall-Spencer, J. M., Colin, C., Frank, N., and Tisnerat-Laborde, N. (2012). 210Pb-226Ra chronology reveals rapid growth rate of Madrepora oculata and Lophelia pertusa on world’s largest cold-water coral reef. Biogeosciences 9, 1253–1265. doi: 10.5194/bg-9-1253-2012
Trathan, P. N., Collins, M. A., Grant, S. M., Belchier, M., Barnes, D. K. A., Brown, J., et al. (2014). The south georgia and the south sandwich Islands MPA: protecting a biodiverse oceanic island chain situated in the flow of the antarctic circumpolar current. Adv. Mar. Biol. 69, 15–78. doi: 10.1016/B978-0-12-800214-8.00002-5
Van Oevelen, D., Duineveld, G., Lavaleye, M., Mienis, F., Soetaert, K., and Heip, C. H. R. (2009). The cold-water coral community as a hot spot for carbon cycling on continental margins: a food-web analysis from rockall bank (northeast Atlantic). Limnol. Oceanogr. 54, 1829–1844. doi: 10.4319/lo.2009.54.6.1829
Vecsei, A. (2004). A new estimate of global reefal carbonate production including the fore-reefs. Glob. Planet. Change 43, 1–18. doi: 10.1016/j.gloplacha.2003.12.002
Keywords: blue carbon, ecosystem services, natural capital, Atlantic Islands, cold corals, Ascension Island, Marine Protected Area
Citation: Barnes DKA, Sands CJ, Richardson A and Smith N (2019) Extremes in Benthic Ecosystem Services; Blue Carbon Natural Capital Shallower Than 1000 m in Isolated, Small, and Young Ascension Island’s EEZ. Front. Mar. Sci. 6:663. doi: 10.3389/fmars.2019.00663
Received: 24 May 2019; Accepted: 10 October 2019;
Published: 07 November 2019.
Edited by:
Furu Mienis, Royal Netherlands Institute for Sea Research (NIOZ), NetherlandsReviewed by:
Andrew J. Davies, University of Rhode Island, United StatesNova Mieszkowska, University of Liverpool, United Kingdom
Copyright © 2019 Barnes, Sands, Richardson and Smith. This is an open-access article distributed under the terms of the Creative Commons Attribution License (CC BY). The use, distribution or reproduction in other forums is permitted, provided the original author(s) and the copyright owner(s) are credited and that the original publication in this journal is cited, in accordance with accepted academic practice. No use, distribution or reproduction is permitted which does not comply with these terms.
*Correspondence: David K. A. Barnes, dkab@bas.ac.uk